Attribution
How much revenue did email actually drive? Different attribution models give different answers — this page lets you compare them and see where the credit lands.
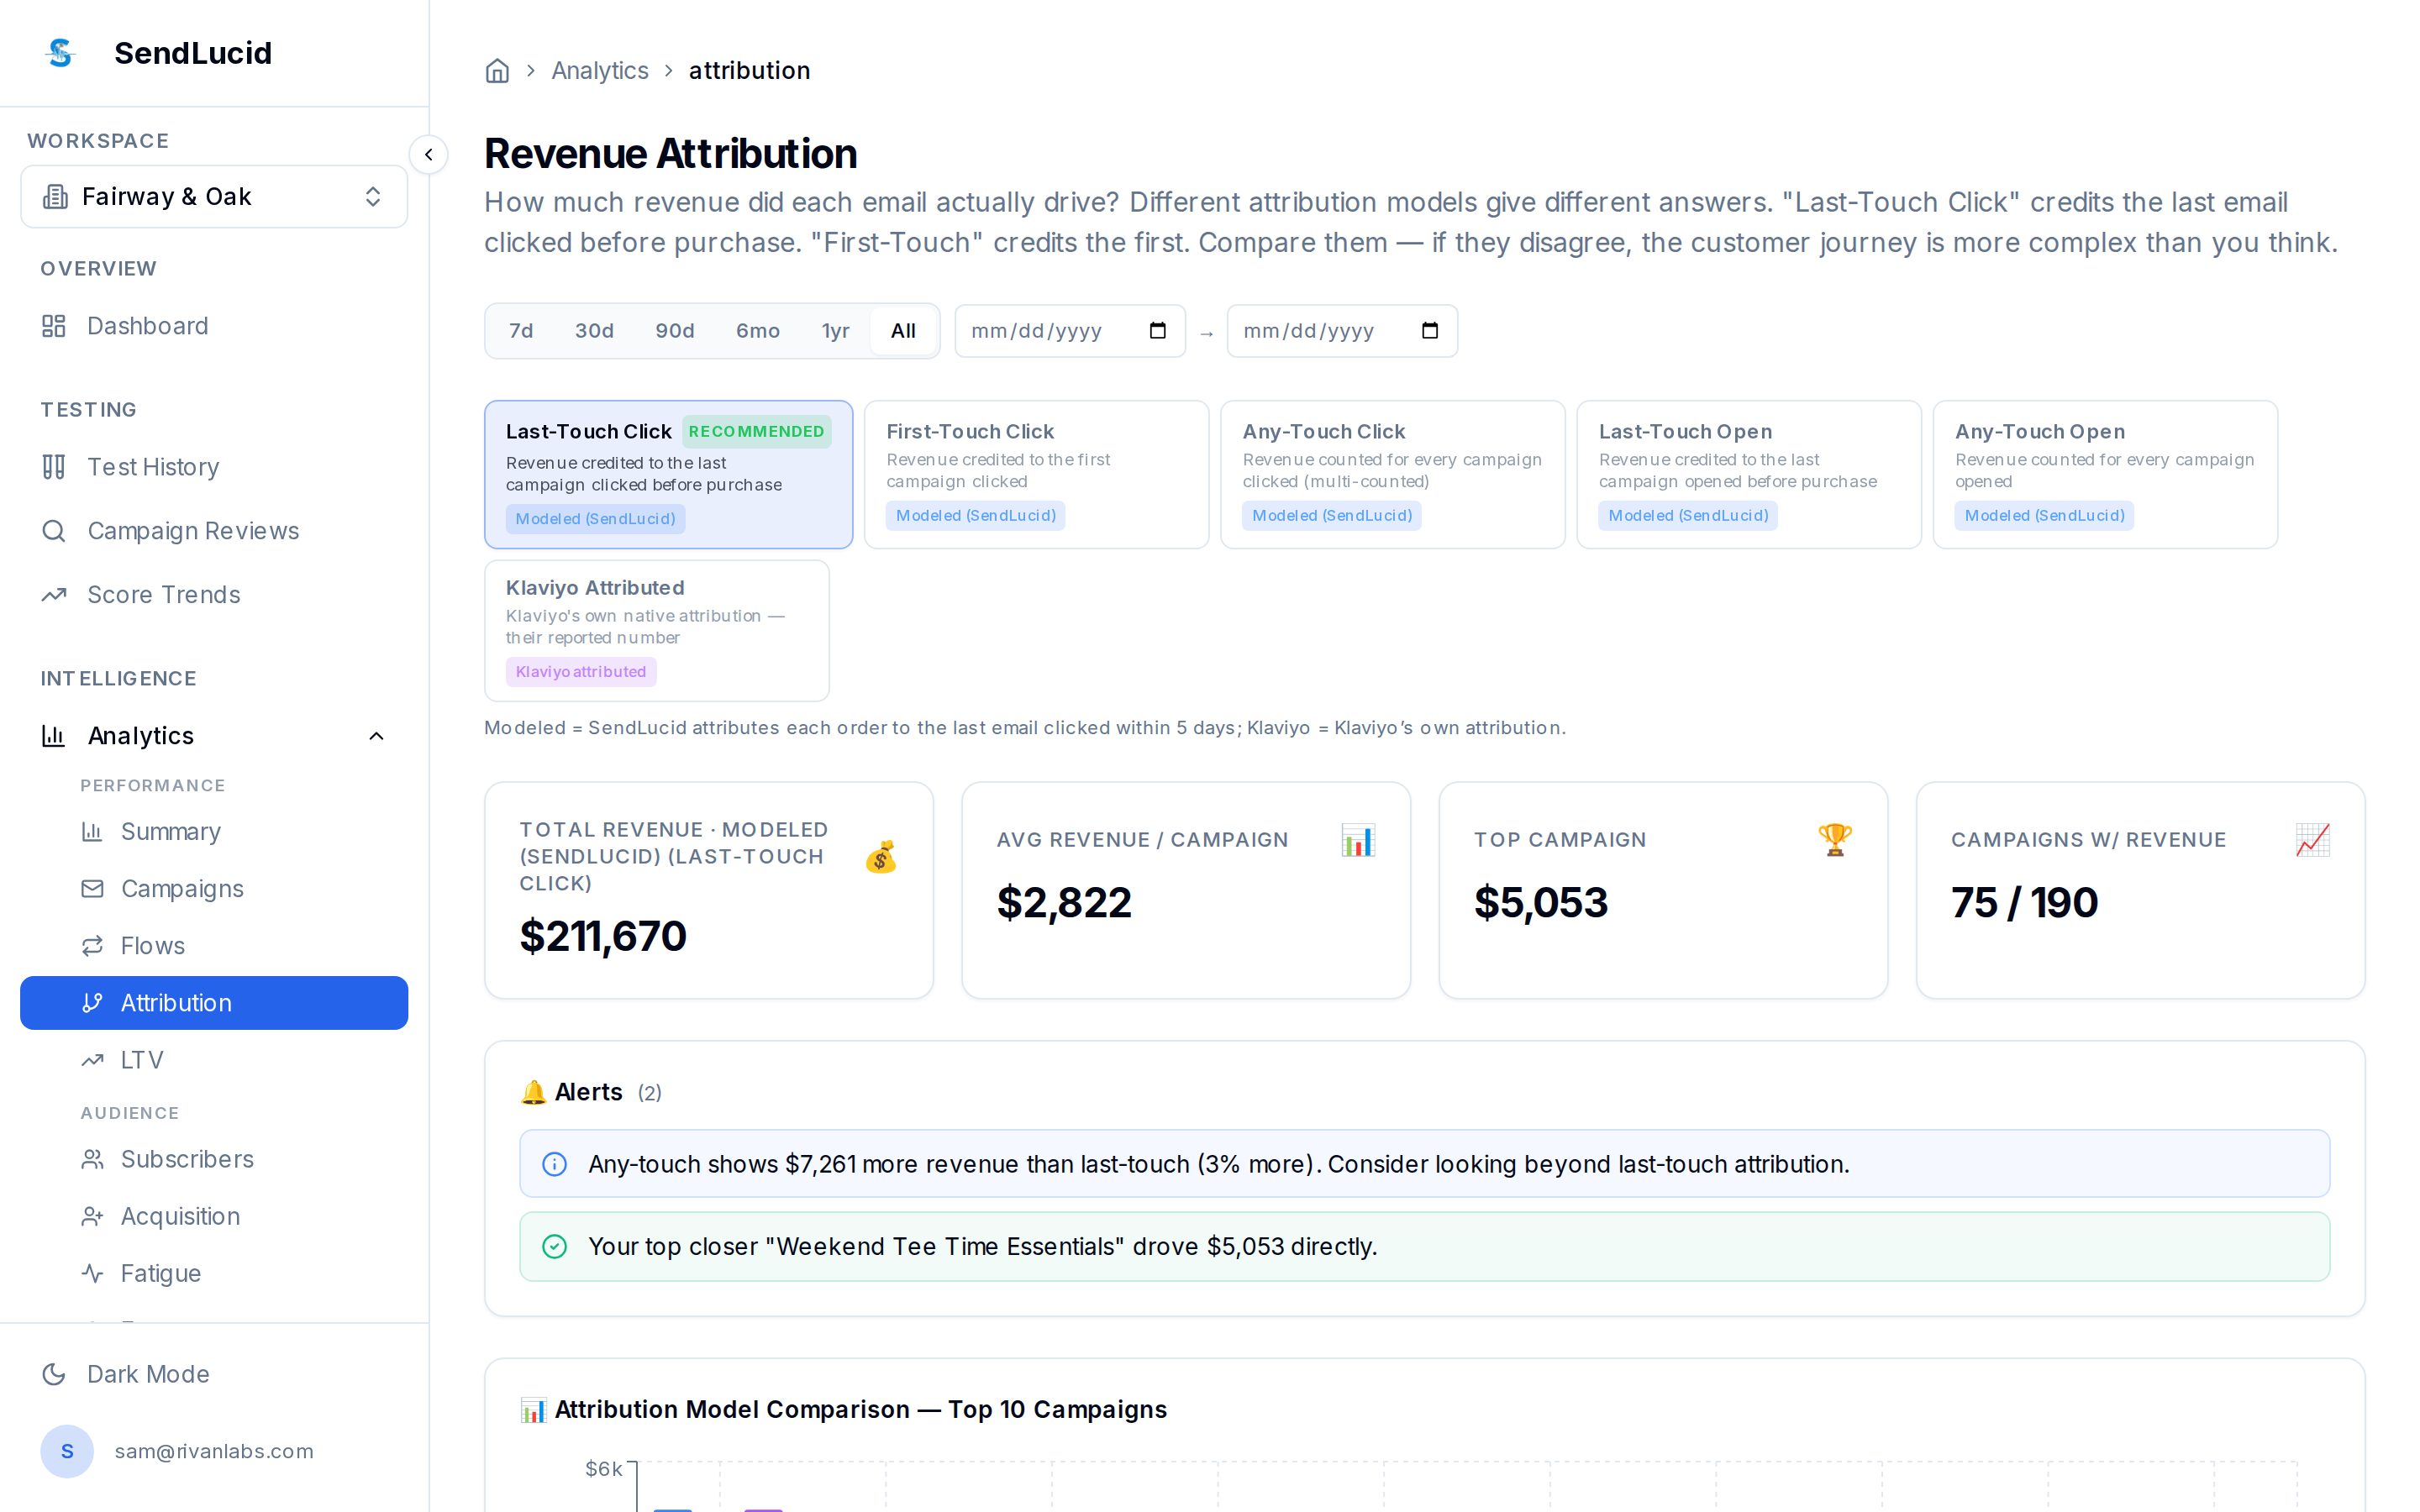
What you see
- Model selector — Last-Touch Click (recommended), First-Touch, Any-Touch, open-based models, and your ESP’s own attribution.
- Headline KPIs — total modeled revenue, average revenue per campaign, your top campaign, and how many campaigns drove revenue.
- Alerts — notable gaps, e.g. “Any-touch shows $7,261 more revenue than last-touch — consider looking beyond last-touch attribution.”
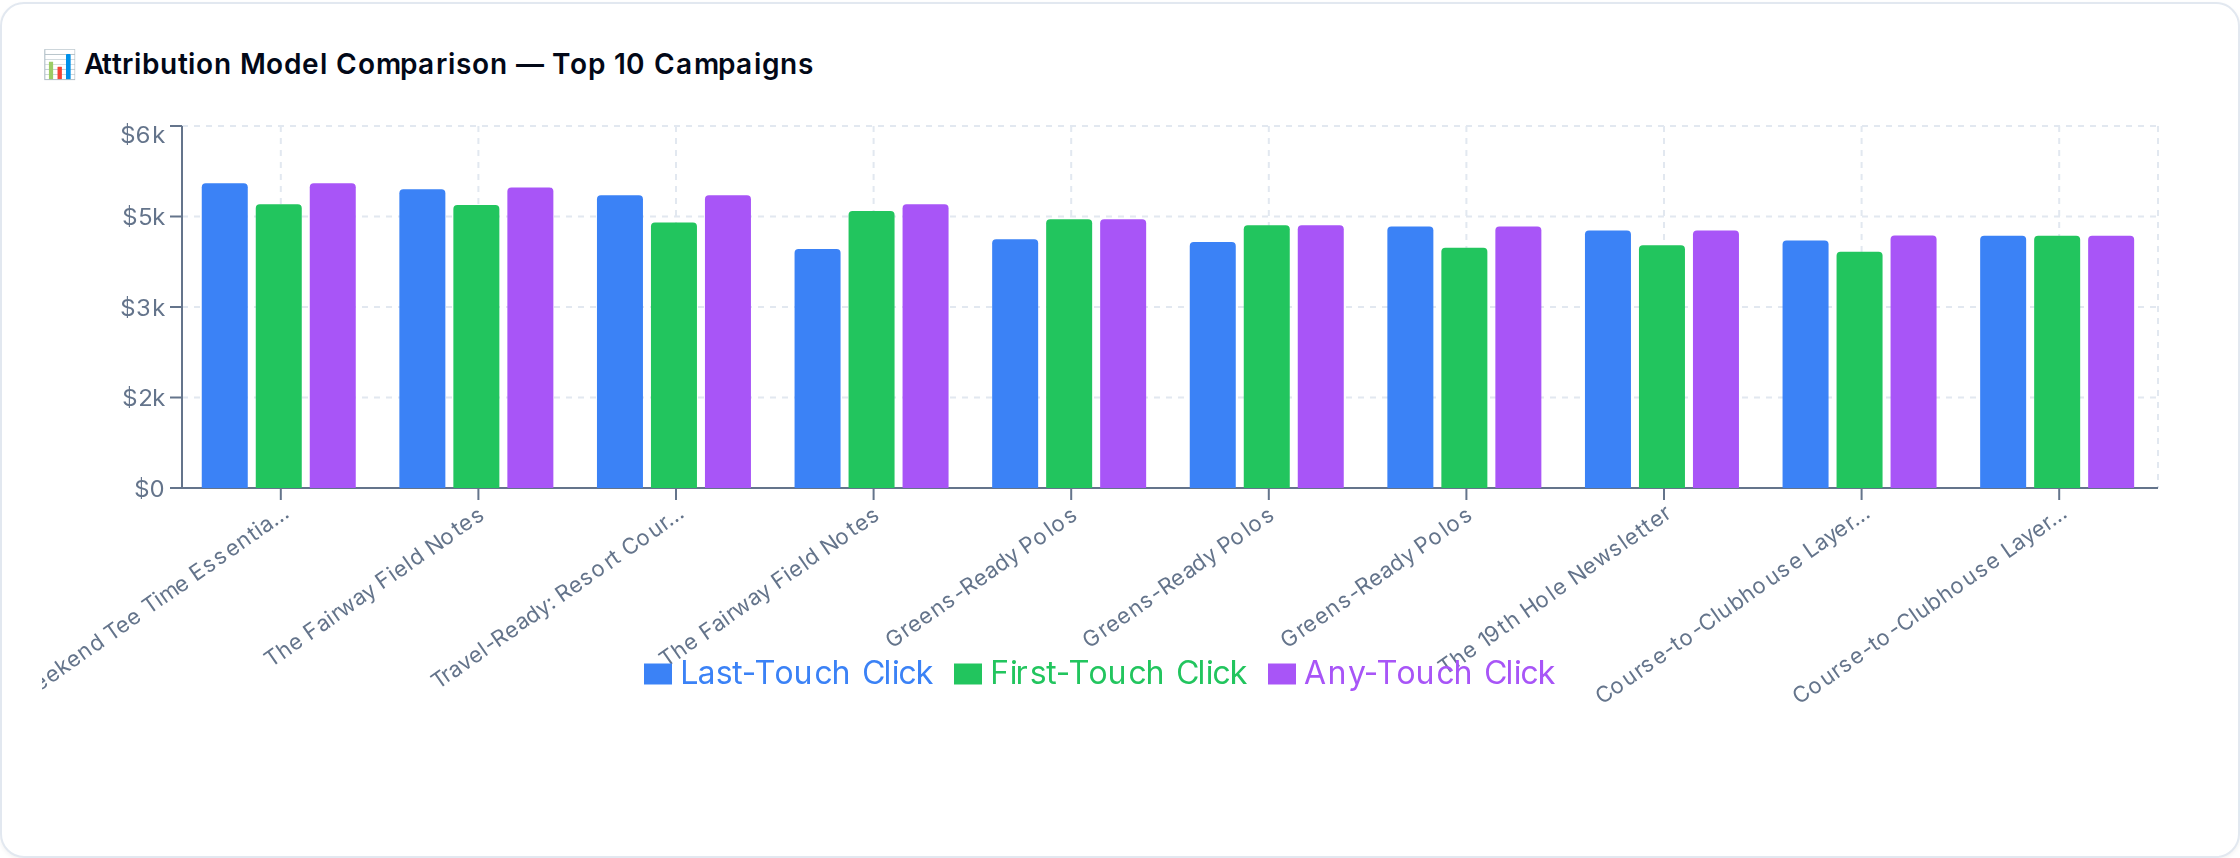
- Attribution Model Comparison — your top campaigns side-by-side across models.
Per-stat breakdown
Headline KPIs

Attribution Model Comparison
How to read it
When models disagree a lot, the customer journey is more multi-touch than a single email — last-touch undercounts assisting campaigns. Use last-touch as your conservative floor and any-touch as the ceiling; the truth sits between.
What to do
Pick one model as your reporting standard and stay consistent. If a campaign looks weak on last-touch but strong on any-touch, it’s an assist worth keeping.